
A cloudy day isn’t necessarily a bad day — at least when it comes to wildlife conservation.
A recent study published in PLOS Biology shows that clouds observed by NASA satellites can be used to help identify suitable species habitats.
Current information on species’ locations and range limits are based on scattered observations from field data and museum collections, said Adam Wilson, assistant professor in the University at Buffalo’s geography department lead author of the study. This information is then combined with environmental data such as temperature and precipitation to make inferences on where species are likely to occur.
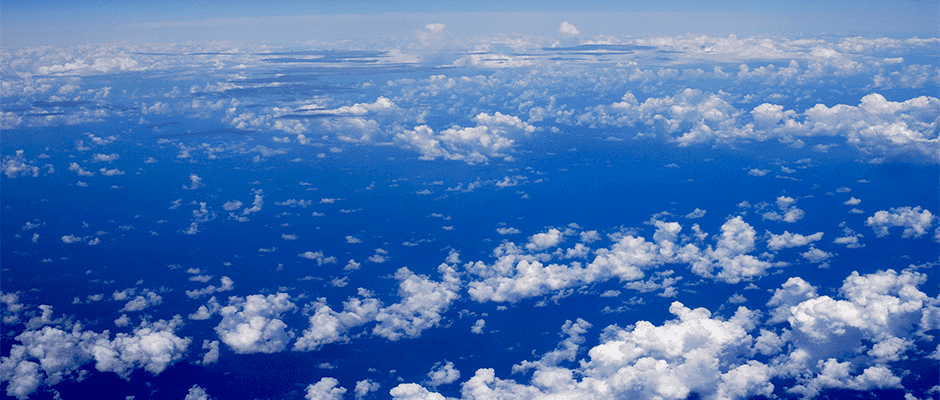
In an effort to improve these distribution models, Wilson and other researchers at the University at Buffalo and Yale University decided to look to the clouds. “Cloud cover is an underappreciated environmental factor that affects many ecological processes,” Wilson said. For example, clouds influence incoming sunlight and available energy as a result. In addition, “some animals behave differently on cloudy versus sunny days,” he said.
Clouds are also easily detected from space. Using NASA’s Terra and Aqua satellites that orbit Earth, the team obtained two observations of cloud cover per day for almost every square kilometer of the planet from 2000 to 2014. These twice-daily images were then processed into long-term summaries capturing the spatial variability of cloud frequency — the proportion of days that are cloudy in each location — globally.

©Adam Wilson
Cloud cover influences how much sunlight reaches habitats and therefore the vegetation that exists, allowing the researchers to make predictions regarding habitat for certain species. Wilson and his team used the data to determine ways to improve predictions of suitable habitat for the montane woodcreeper (Lepidocolaptes lacrymiger), a South American arboreal songbird and similarly for king protea (Protea cynaroides), a South African shrub. They also showed how the data could be used to map entire ecosystems such as the world’s cloud forests — tropical or subtropical forests with persistent low-level clouds.
Models for species distributions are often based on information from weather stations such as precipitation. However, some of the most biodiverse places on Earth, such the Amazon basin, don’t have many weather stations. These cloud data, supplemented with local observations, can help create a globally consistent picture of environmental suitability and allow scientists to track the data in near-real time. People can access and visualize the remote sensing images at http://www.earthenv.org/.
“Higher data quality in general leads to better predictions and decision making,” Wilson said. “We hope that these data will be useful to continue improving our knowledge, designing more efficient management plans, and developing effective policies to conserve biodiversity for future generations.”
Tracking deer by satellite
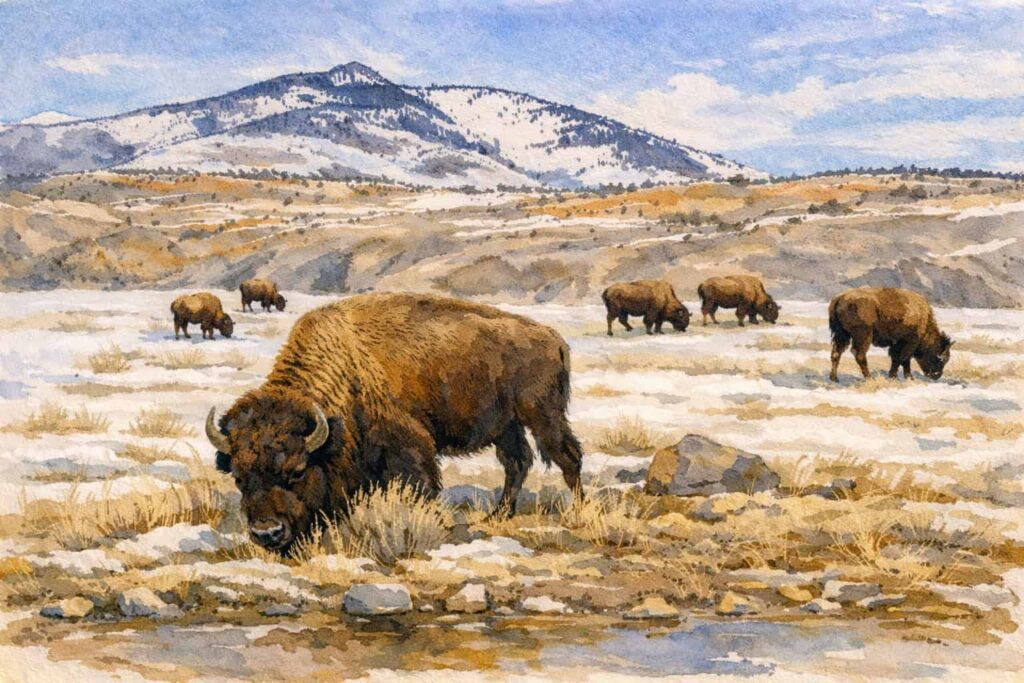
NASA satellites have been proven to also help with tracking mule deer (Odocoileus hemionus) populations and allow wildlife managers to predict when does will give birth to fawns, according to another study recently published in PLOS One.
“We had never tracked the deer population this way, and we had never been able to predict it with such precision,” said David Stoner, a postdoctoral fellow at Utah State University and lead author of the study in a press release. “We can estimate the start and peak of the season using satellite imagery, and then we can map and predict when the deer are giving birth in any region.”
Remote sensing scientists are able to track when vegetation gets green and how productive it is compared to drought and wet years through a tool called the Normalized Difference Vegetation Index (NDVI). Greenness in the landscape is measured by how plants absorb and reflect light, and if there is more infrared light reflected, that means the vegetation is healthier.
As part of their study, the researchers were able to measure the greenness — as calculated by the ratio of red to infra-red that correlates with plant photosynthesis activity — of the mule deer habitat to determine the beginning and peak of plant growing season and fawning season.
“This kind of applied research is very important for making remote sensing data relevant to wildlife management efforts,” said Jyotwshwar Nagol, a researcher at the University of Maryland in the release.
Article by Dana Kobilinsky