
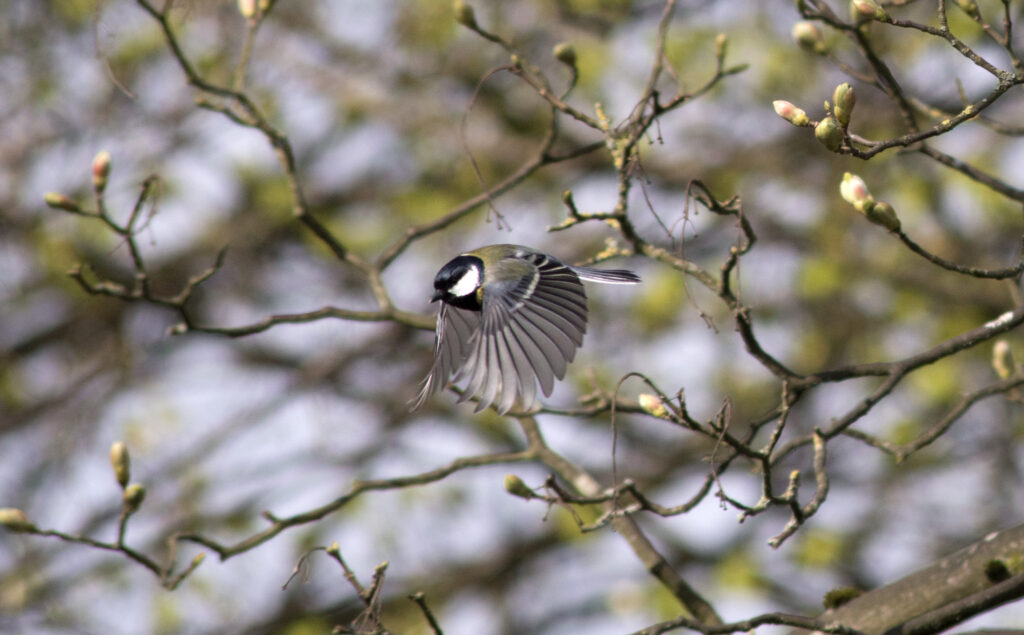


Researchers say they have been able to model population trends of more than 500 bird species in the U.S., determining whether populations are rising or falling even at the local level. The information, including detailed trend maps for each species down to an eight-mile radius, could help conservationists gauge how local populations are faring.
“One of the things that’s new about this analysis is the spatial resolution,” said Daniel Fink, senior research associate at the Cornell Lab of Ornithology and the lead author of the study published in Methods in Ecology and Evolution. “That sort of regional landscape information is very novel.”
Another unique aspect of the study is its focus. The study looks less at birds than it does at birders—the citizen scientists who contribute sightings to the Cornell Lab’s popular eBird app.
Citizen science can give researchers remarkable data, but the findings are subject to the accuracy of the participants. Since human behavior can be even more confounding than wildlife behavior, researchers at the Cornell Lab have had to wrestle with changes in how birders record their findings.
By using a type of artificial intelligence known as double machine learning, Fink and his team sought to account for year-to-year changes in the behaviors of eBird contributors.
“We’re trying to get as much information out of that citizen science project as we can and make it as solid as we can,” Fink said.
As people get better at identifying birds, go birding in new spots or get better tools to bird with, their reporting often changes over time. Those changes can affect abundance estimates for bird species. By looking for variations in bird counts and coupling that with variation in birders’ behaviors, researchers used double machine learning to screen out the behavior changes and better account for bird numbers.
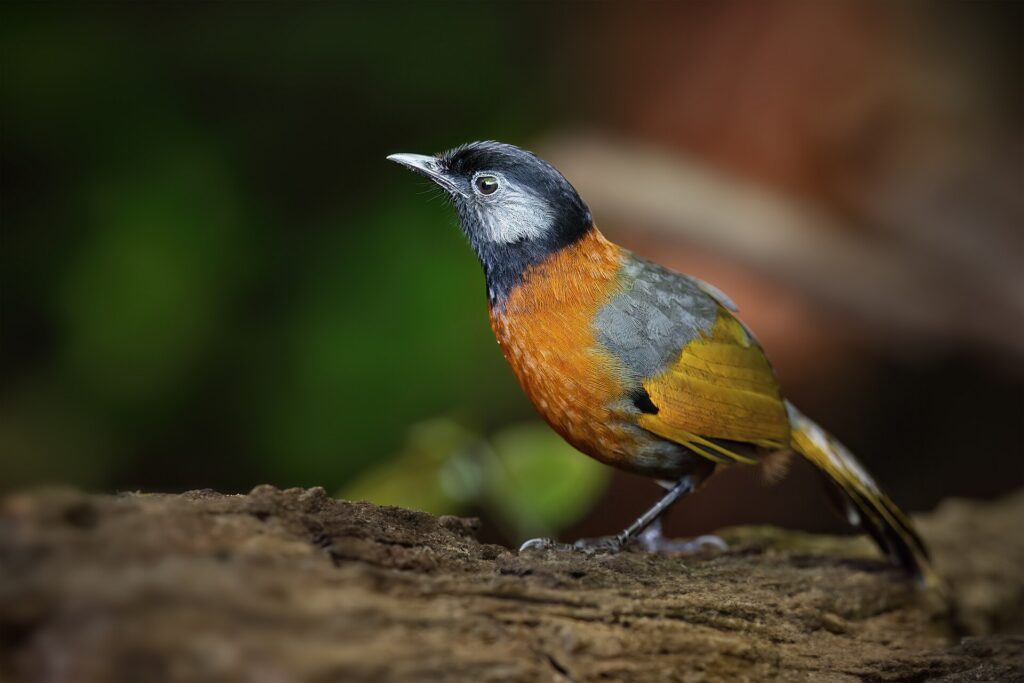
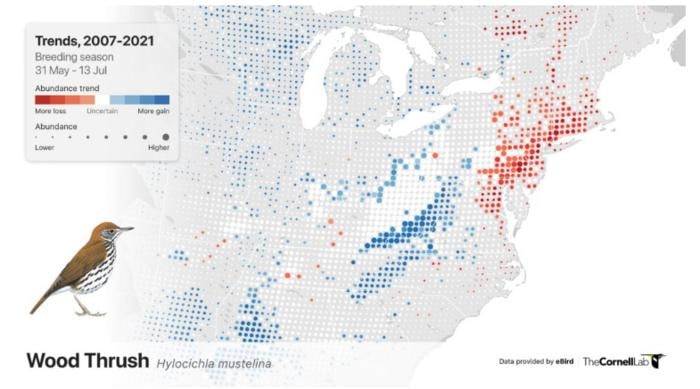
The result, researchers say, is a set of highly detailed population estimates for a broad number of birds. The maps they created show variations within the same species across their ranges. Wood thrushes (Hylocichla mustelina), for instance, appear to be increasing in western populations but declining in the eastern U.S. Northern cardinals (Cardinalis cardinalis) showed declines in the south, gains in the north and falling populations around cities.
These detailed maps can give conservationists a better sense of where to focus their attention and look for what might be causing declines in specific areas, Fink said.
The technique could be applied to other citizen science programs, he said, to allow for more accurate estimates—particularly in spots on the map where more formal research is lacking.
“It opens up that door,” he said.
Article by David Frey