

A new visualization tool for radar data is revealing bird migrations as they have never been seen before. With the new tool, birds’ nocturnal journeys appear as blue streaks that sweep across a map like raindrops on glass.
“[Songbirds] all travel at night, or almost all of them. So most of the migration, in fact, you can’t even see,” said Judy Shamoun-Baranes, an ecologist at the University of Amsterdam and first author of the study published yesterday in PLOS ONE. “You’ll only see them coming in in the morning, maybe, and landing, or you’ll suddenly see birds that weren’t there the day before.”
Humans may have difficulty seeing in the dark, but radar stations — the same ones that track weather or enemy aircraft — pick up signals from birds regardless of whether the sun is shining. Radar detects objects by sending out radio waves and measuring how long they take to bounce back. Birds move differently than drifting objects like seeds, and with the right software, researchers can isolate signals from large numbers of birds moving together. These signals contain information about how fast birds are moving, what direction they’re traveling and approximately how many are in the air. But the information is so complex that it can be hard to interpret, especially over large areas with multiple radar stations.
“For us, what’s always difficult is that you’re trying to integrate all of that information at once,” said Shamoun-Baranes. “You want to be able to tell a story, in a relatively simple visualization, which really gives you this feel for the flow of movement across a large landscape.”
To translate their data into something visual and intuitive, Shamoun-Baranes and her colleagues gathered an interdisciplinary team including meteorologists, biologists, computer scientists and visual designers. They developed two visualization programs and tested them on two case studies, one from Europe and one from the United States. The European case study used data from five weather radars in the Netherlands and Belgium during the spring 2013 migration, while the U.S. case study used data from 13 weather radars in the Northeast during the fall of 2010.
People can experiment with the European case study here, and with the U.S. case study here. The blue streaks show the aggregate movements of many birds, with longer streaks representing faster flight. Users can skip around using the time counter and control buttons above the map, or just watch the patterns; on the U.S. map, a night’s worth of migration goes by in about a minute and a half. The times are in UTC.
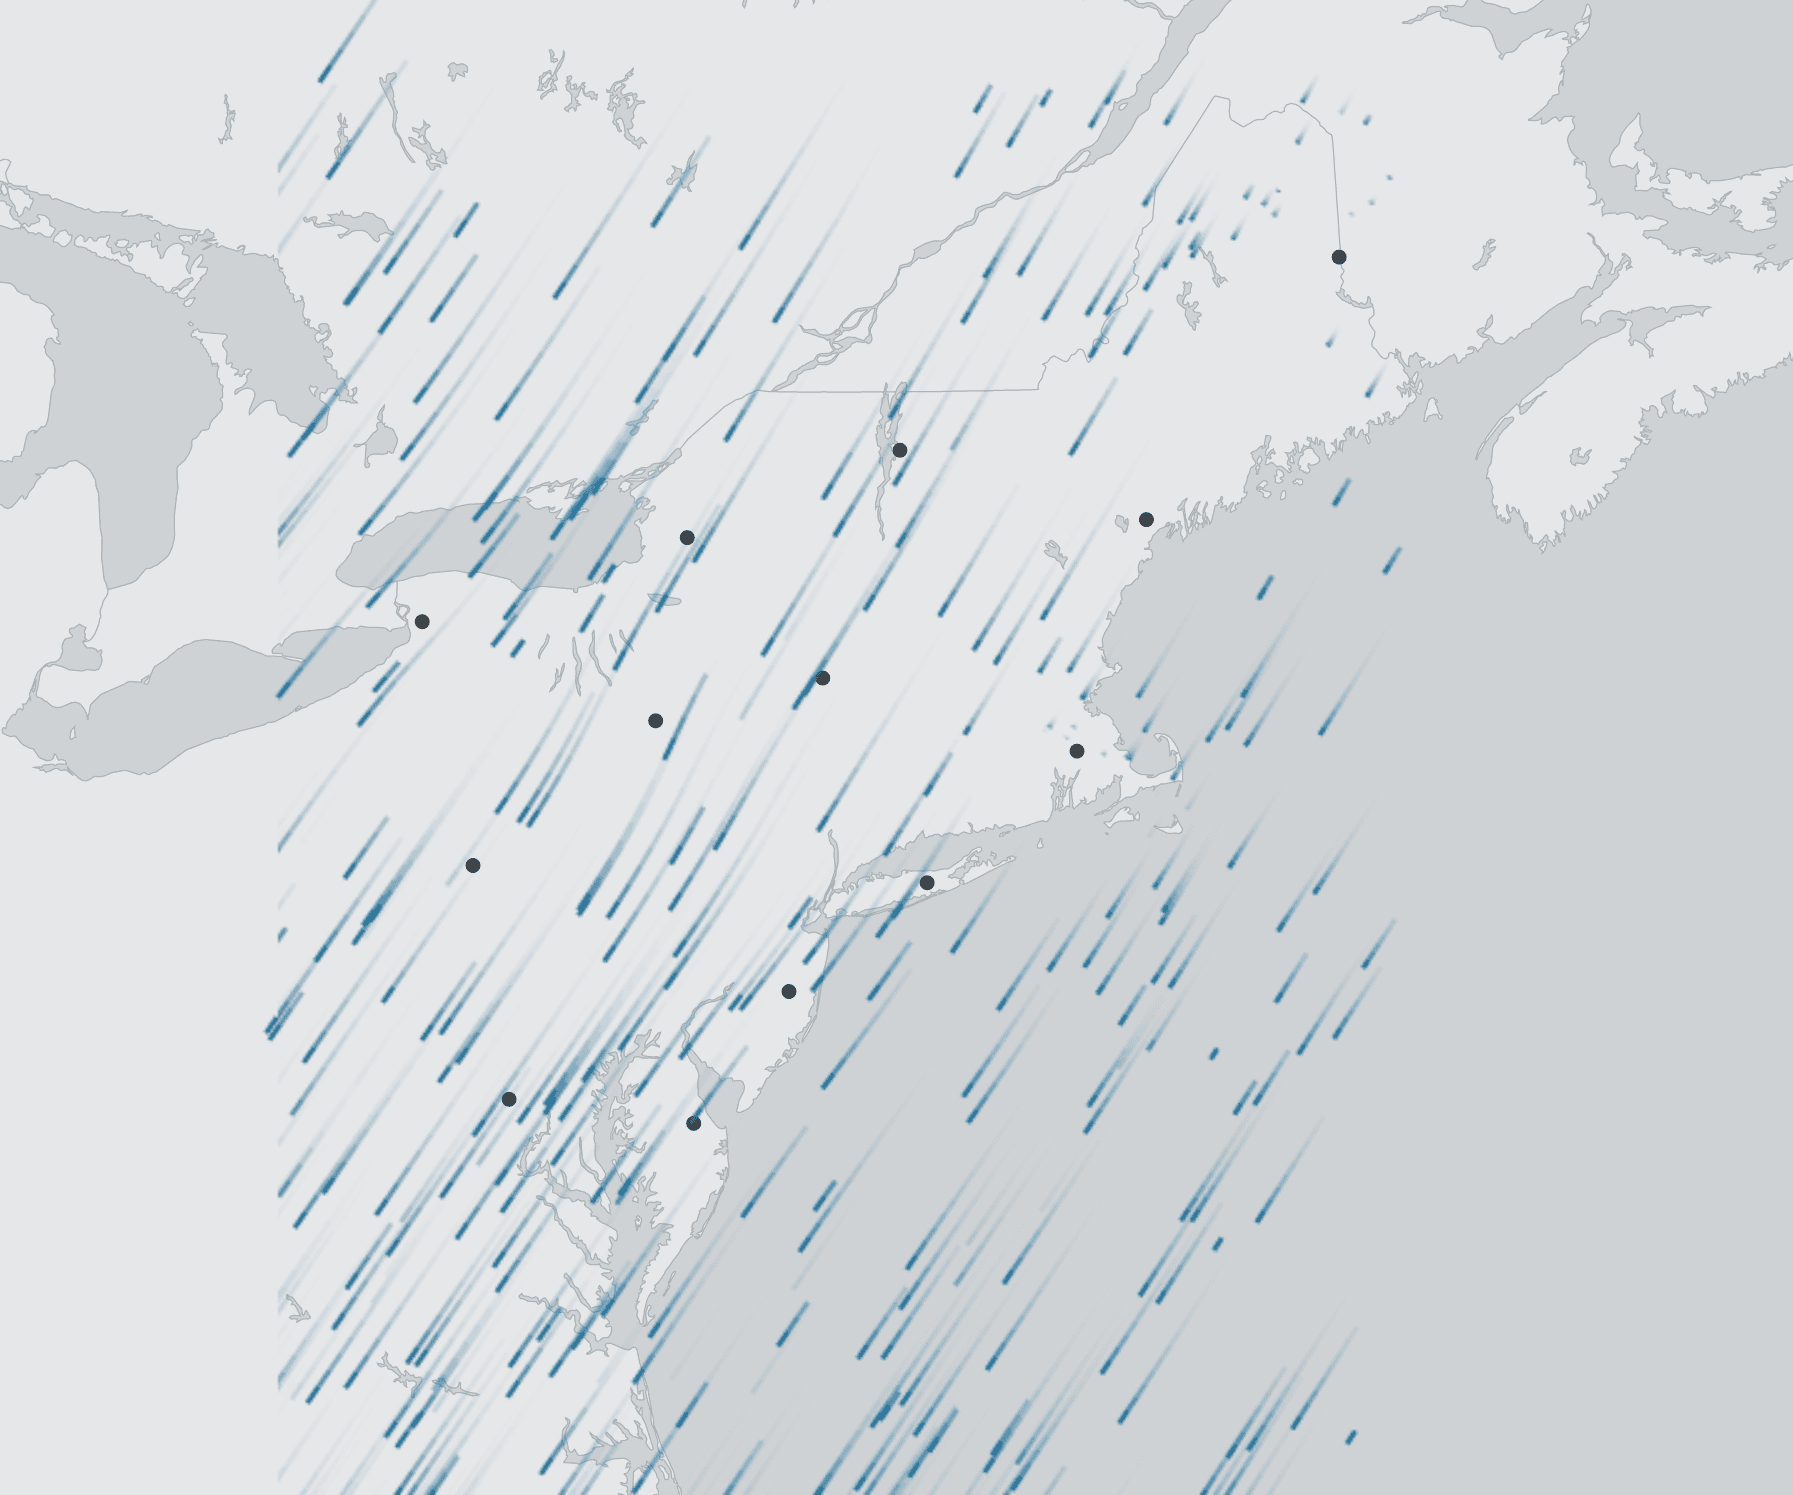
The visualizations reveal the different routes birds choose from day to day. For example, on the night of Sept. 11, 2010, birds across the northeastern U.S. chose a southwestern trajectory:
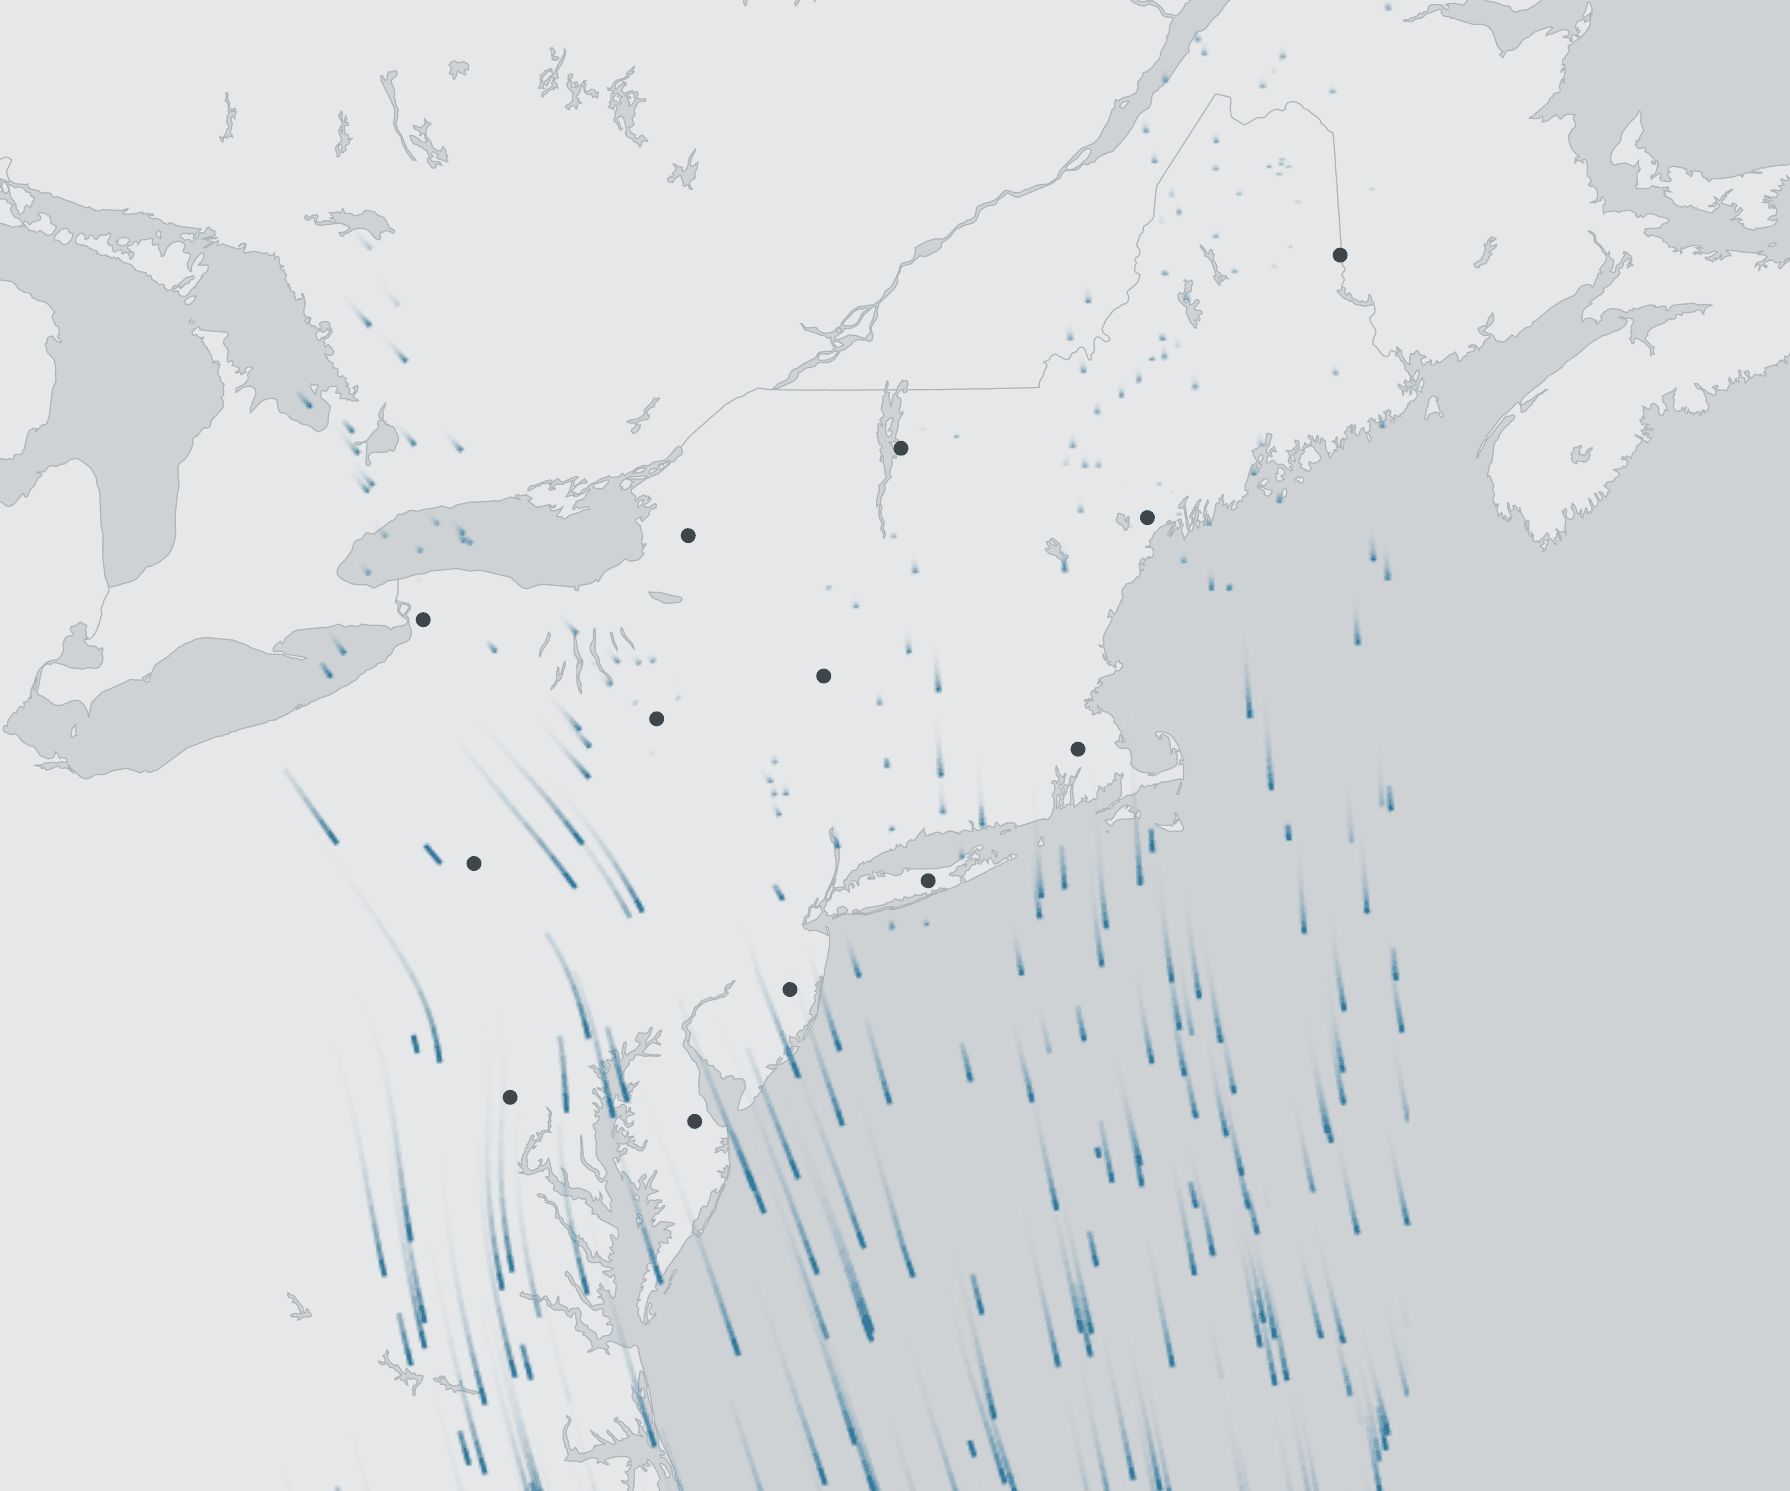
Two days earlier, on Sept. 9, few birds were migrating in Maine and New Hampshire. But birds further south and along the coast took off on trajectories that angled slightly east, taking them over the Atlantic Ocean:
Shamoun-Baranes says such variations are often influenced by weather. Bird species that favor particular routes may wait for the wind to shift, choosing conditions that will help them on their journeys. The ability to see and predict such patterns could help pilots avoid collisions, and it could also help researchers understand the choices birds make. For example, if researchers notice that birds avoid a particular area, they could investigate potential explanations, such as light pollution from cities, says Shamoun-Baranes.
In addition to the visualization with moving blue streaks, the researchers also developed a static visualization that uses colors to represent birds at different altitudes. The second visualization is trickier for non-experts to interpret, but people can experiment with it here and here.
All the code is open-source, and Shamoun-Baranes hopes that researchers will pick it up and use it with their own data, modifying the software as they see fit. The tools could also help researchers share information about bird migrations with the public, letting people see an aspect of nature that is usually hidden. Shamoun-Baranes imagines that someday, such tools could even make their way onto TV.
“So imagine, you get the news, and then you get the weather report, and then you get the bird migration report or the bat migration report,” she said. “Instead of just watching the weather, we can actually watch the migration, which is picked up, in fact, by the same sensors.”
Article by Nala Rogers