

Share this article
Conserving Forest Biological Diversity – from The Wildlife Professional
From the summer 2015 issue of The Wildlife Professional
How the Montreal Process Helps Achieve Sustainability
Forests support a variety of ecosystems, species and genes — collectively referred to as biological diversity — along with important processes that tie these all together. With the growing recognition that biological diversity contributes to human welfare in a number of important ways such as providing food, medicine and fiber (provisioning services); controlling insect pests or water flows (regulating services); furnishing recreation or spiritual fulfillment (cultural services); and providing soil and nutrients for plant growth (supporting services) (Millennium Ecosystem Assessment 2005), societies worldwide are starting to understand that these services depend directly upon the condition of their ecosystems and cannot be taken for granted.
Human population growth, increasing consumption and the resulting impacts on forest habitats can compromise the capacity of forests to provide these services sustainably (Balmford and Bond 2005).
Deleterious impacts include reducing species populations or ranges, introducing invasive species and alternating or fragmenting habitats.
Aldo Leopold, who is widely considered the father of wildlife management, called for the conservation of biological diversity when he wrote in A Sand County Almanac, “To keep every cog and wheel is the first precaution of intelligent tinkering.” But how do we know whether human environmental management is intelligent; how do we measure and monitor our conservation of biological diversity; and how do we coordinate this conservation across international borders? Here we describe a standard, yet flexible, framework for examining these questions and illustrate it with examples of forest biological diversity monitoring from three diverse countries.
Montreal Process Criteria and Indicators
Originally created in 1995 and last revised in 2014, The Montreal Process (MP) provides a standard, international framework for assessing the sustainability of forest ecosystems in terms of their ecological, social and economic components (Montreal Process 1999, revised 2014). Following the 1992 Earth Summit in Rio de Janeiro, 12 countries — Argentina, Australia, Canada, Chile, China, Japan, Korea, Mexico, New Zealand, the Russian Federation, the United States and Uruguay — joined together in 1994 to form the MP Working Group to promote development and use of an “internationally agreed upon” set of criteria and indicators for conserving and sustainably managing forests around the world. Some countries not in the MP have developed similar approaches for sustainable management of forests such as the Pan-European Criteria and Indicators.
At its heart, the process relies upon a “mutually agreed upon” set of indicators or metrics of forest sustainability that are organized under seven broad criteria, including criterion 1, which focuses on the conservation of biological diversity (see box). The resulting framework provides a systematic approach to gathering, tracking and presenting information relevant to the comprehensive assessment of forest sustainability. Ideally, government ministries or agencies in each country conduct and publish these assessments every five years. Given the diversity of the 12 reporting countries, the MP includes a broad range of cultures and institutional capacities as well as an immense diversity of forest types and conditions. Consequently, the reporting process includes flexibility in the delivery time and format of the reports.
Montreal Process Criterion 1Conservation of Biological Diversity 1.1 Ecosystem Diversity 1.2 Species Diversity 1.3 Genetic Diversity |
For example, Australia, which has produced three previous reports, and China have both recently completed their MP reports (Montreal Process Implementation Group for Australia and the National Forest Inventory Steering Committee 2013; State Forestry Administration P.R. China 2013). The United States completed its reports for 2003 (U.S. Department of Agriculture Forest Service 2004) and 2010 (U.S. Department of Agriculture Forest Service 2011) and is in the process of completing its third edition this year. Examples of the indicators, data sources, analyses and presentation strategies used by these three countries to monitor conservation of biological diversity are presented below.
Indicators of Biological Diversity Conservation
MP Criterion 1, “Conservation of Biological Diversity,” includes nine indicators: three that address ecosystem diversity; three that are focused on forest-associated species; and three that consider the genetic diversity of forest-associated species. Australia treats criterion 1 indicators in a narrative fashion, combining quantitative information with 84 pages of text and case studies much like a book chapter (Montreal Process Implementation Group for Australia and the National Forest Inventory Steering Committee 2013).
China’s approach is similar to Australia’s and includes a wealth of information, but the national level forest inventories and related activities are newly established and often lack time series information. Case studies figure prominently in China’s report (State Forestry Administration P.R. China 2013), particularly those related to the giant panda (Ailuropoda melanoleuca), one of the most charismatic of all megafauna.
The U.S. uses a more structured approach to reporting and presents each indicator in a standardized, abbreviated format — one or two pages per indicator — focused heavily on updating data elements and noting trends over time (U.S. Department of Agriculture Forest Service 2011).
Ecosystem Diversity. Many countries already conduct a national forest inventory (NFI) to assess the composition, structure, ownership and spatial pattern of their forest resources, each of which is important to understanding ecosystem diversity. These inventories are subject to ongoing revisions that sometimes confound trend analyses.
Australia, for example, uses its NFI to report area and percent of forest by type (1.1a). By this measure, the country reports that 16 percent of its land area is covered in forests, with the vast majority (98 percent) of this being designated as “native forests.” The country also reported a 16 percent reduction in total forest area since 2008 as a result of improved inventory data and not an actual loss of forests.
Regarding area and percent of forest in protected areas (1.1b), China’s 2013 report shows that areas of forests in protected area designations increased from 5.99 million hectares in 1994-1998 to 14.37 million hectares in 2004-2008, with local level protection showing the most dramatic increase.

The U.S. Forest Service’s Forest Inventory and Analysis Program (FIA) collects plot-sampled field data. The Service also uses remote sensing data to assess forest cover and landscape patterns. By using repeated inventory plot measurements and multiple satellite sensors that provide recurring global imagery, USFS can now assess changes in forest habitats more frequently and consistently. For example, the majority of U.S. interior forest in 2006 was in states of the Northeast, Appalachia, Upper Great Lakes, South and Mountain West (Figure 1; Riitters 2011). Net loss of interior forest between 2001 and 2011 was concentrated in the Southeast, desert Southwest and Front Range of the Rockies.
Figure 1
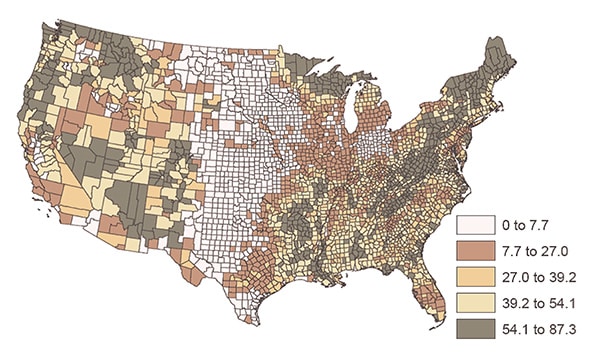
The percent of all U.S. forests by county that is interior forest (greater than 90 percent forested) when analyzed at an approximately 15.2-hectare (40-acre) scale. Larger legend values indicate that a larger percentage of the existing forest in a county is relatively intact in comparison to forest in other counties. In this quantile map, equal numbers of counties are shaded with each color.
Source: Riitters 2011
Species Diversity. Australia, China and the U.S. all rely upon biological sampling activities; U.S. sources include North American Breeding Bird Survey and compiled datasets such as NatureServe Explorer to report numbers of species (1.2a). Recent improvements to techniques and expansions of sampling effort have yielded higher counts, but still contain data gaps. The gaps are larger for some taxa than for others. Australia’s forest-dwelling vertebrate species increased from 1,227 in 1998 to 2,212 in 2011. Likewise, Australia’s tally of forest-dwelling vascular plants has increased from 13,622 to 16,836 over the same period, although the 2011 number was identified as provisional. These examples illustrate that improved diversity information results from targeted surveys and more intensive effort.
In the U.S., extending the forest inventory to vascular plants not included in previous inventories resulted in upwards of 10,000 additional species records between the 2003 and 2010 reports. Conversely, preliminary estimates for the 2015 U.S. report show a decline of more than 3,000 species, due in large part to revisions to which vascular plants were defined as “forest-associated.” The Chinese report presents an impressive amount of information for select species, including five decades of time series data for giant panda populations and habitat abundance, both nationwide and by nature reserve.
As more data have become available on species diversity, it is becoming evident that more consistent and complete datasets are needed both within and between countries. A country-wide scale might not adequately describe a nation’s indicators of species diversity. Other information and analysis approaches may be needed that look at geographic extents that are smaller or larger than a country.
The 2010 U.S. report, for example, displays trends in forest bird species counts by ecoregion for the time periods 1975-2006, based on the U.S. Geological Survey’s well-established Breeding Bird Survey (Figure 2; Flather et al. 2011). In the upcoming 2015 report, the data compares the periods of 1975-1999 with 1999-2013 and shows increasing species count in 38 U.S. ecoregions (38 percent of the total area) and declining counts in 44 ecoregions (49 percent of the total area), which highlights the challenge of applying sustainability concepts to dynamic, scale-dependent phenomena in an attempt to derive national level sustainability assessments.
Figure 2
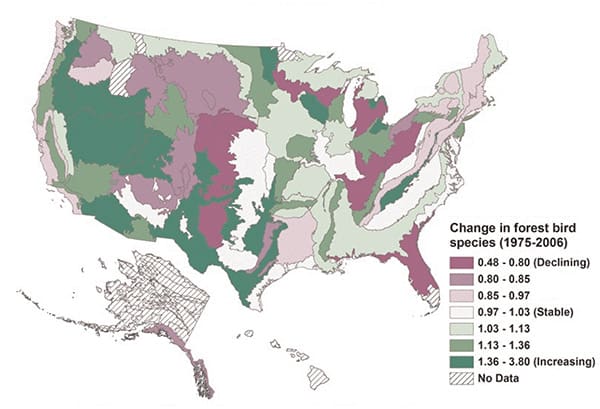
The estimated change in the number of U.S. forest-associated bird species from 1975-2006. Change is measured by the ratio of the 2006 species count estimate to the 1975 estimate. Values greater than 1 indicate increasing species counts (green shades); values less than 1 indicate declining species counts (purple shades) (Flather et al. 2011).
Source: U.S. Geological Survey Breeding Bird Survey

Credit: Bruce Marcot, USFS
Genetic Diversity. Genetic diversity is more difficult to measure and manage than species diversity. Because direct measures of genetic variation are not widely available, geographic ranges for species and subspecies often are used as proxies. By this measure, shrinking ranges serve as cautionary signals that genetic variability may be at risk.
For example, conservation of geographically disparate distributions of five subspecies of the red-tailed black-cockatoo (Calyptorhynchus banksii) in Australia serves to maintain the genetic diversity among those subspecies and within the species (Figure 3; Montreal Process Implementation Group for Australia and the National Forest Inventory Steering Committee 2013).
Figure 3
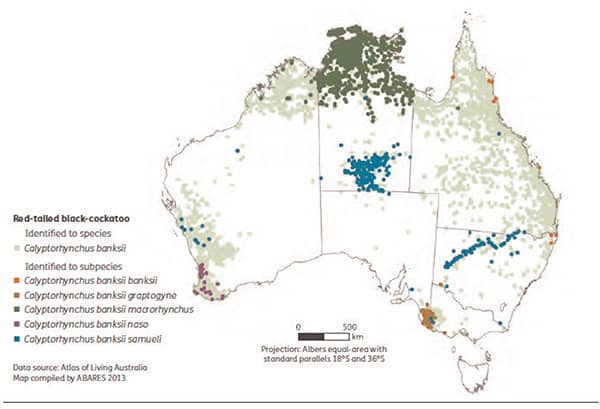
The distribution of the red-tailed black-cockatoo (Calyptorhynchus banksii) and its subspecies in Australia in 2013.
Source: Australia’s State of Forest Report: Montreal Process Implementation Group for Australia
and the National Forest Inventory Steering Committee 2013
The rate of extirpation — or loss of a species from a subset of its overall range — is another signal, as shown in an example from the U.S. (Figure 4; Flather et al. 2011). In fact, where information on U.S. ‘infraspecies’ exists — including subspecies, varieties and subpopulations — the range contracts more rapidly than for the full species.
Figure 4
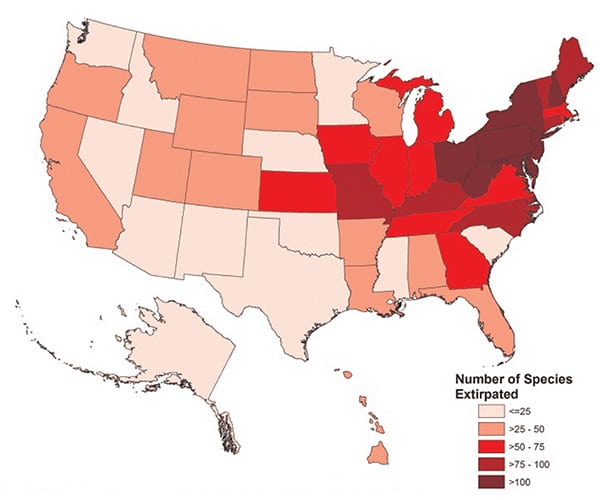
The number of U.S. forest-associated species in 2009 — including vascular plants and vertebrates but excluding freshwater fish and select invertebrates — that have been extirpated within each state.
Source: NatureServe (Flather et al. 2011)
Other Biodiversity Conservation Activities
In addition to managing species and infra-species, USFS also conducts conservation activities in laboratories, greenhouses, arboreta, seed banks, seed orchards and similar facilities. For example, ash trees (Fraxinus spp.) are widely distributed in North American forests, and their large seed crops provide food for many species of wildlife, including game and nongame animals and birds. But ash trees are threatened by a non-native invasive insect pest, the emerald ash borer (Agrilus planipennis Fairmaire). In response, the National Plant Germplasm System initiated an ash seed collection program as a genetic data back-up and has placed seed at secure seedbank facilities throughout the world.
In China, giant pandas are slowly rebounding from their nadir in the 1980s but still are well below numbers recorded for the 1960s. Panda captive breeding efforts, while not a panacea for onsite conservation, serve to maintain genetic diversity for future generations and to inform and motivate the public on the need for conservation.
Take Home Lessons
The examples presented above illustrate how three countries with markedly different ecological and socioeconomic conditions have addressed information requirements presented by the criteria and indicators in the MP for monitoring conservation of biological diversity. Forest ecosystem diversity may be improving at a gross scale as evidenced by the positive forest area indicators, but species diversity numbers show ongoing declines resulting from habitat degradation, fragmentation and pollution. Reductions in species populations and shrinking geographic ranges negatively impact genetic diversity.
Ideally, each indicator would include concise, consistent and repeated measures that can be related directly to sustainability assessment according to the vision underlying development of the criteria and indicators. In practice, changes to monitoring intensity and methodology may confound biodiversity trend analyses; therefore, indicators need to be interpreted within the broader context within which they are presented. Furthermore, biodiversity priorities vary among countries, illustrated by their corresponding criteria and indicators reports — the concise and consistent measures presented in U.S. reports, or the more flexible and comprehensive approaches of the Australian and Chinese reports.
Despite these challenges and differences in reporting styles, the MP with its criteria and indicators continues to provide a common framework for measuring and monitoring conservation of biological diversity and coordination of conservation efforts across international borders.
 Mark Nelson, PhD, is a research forester with the USDA Forest Service, Northern Research Station, St. Paul, Minn. and a member of the TWS Biological Diversity, Forestry and Wildlife, and Spatial Ecology and Telemetry Working Groups.
 Guy Robertson, PhD, is national sustainability program leader with the USDA Forest Service, Inventory, Monitoring and Assessment Research Staff, Washington, D.C.
 Kurt Riitters, PhD, is a research ecologist and team leader with the USDA Forest Service, Southern Research Station, Eastern Forest Environmental Threat Assessment Center, Research Triangle Park, N.C.
The Wildlife Professional is a TWS member benefit. Join TWS to take advantage of this and other member benefits.
USFS is a Premier Partner of TWS.

Header Image:
A giant panda rests in a tree. The data reported by China using the Montreal Process indicate that this iconic species is coming back from its historical lows.
Image Credit: iStock
Related Posts

Q&A: TEK and the wildlife profession
Tracing a trajectory from “elitism” to “equity”
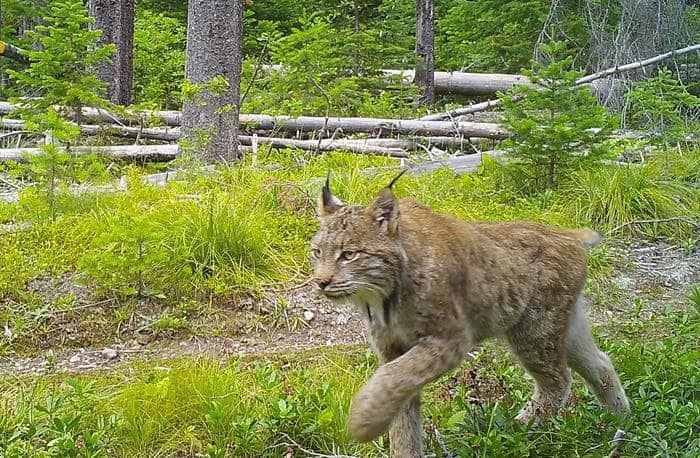
History may point to a brighter future for Canada lynx
Areas the predator once roamed may be able to support them again
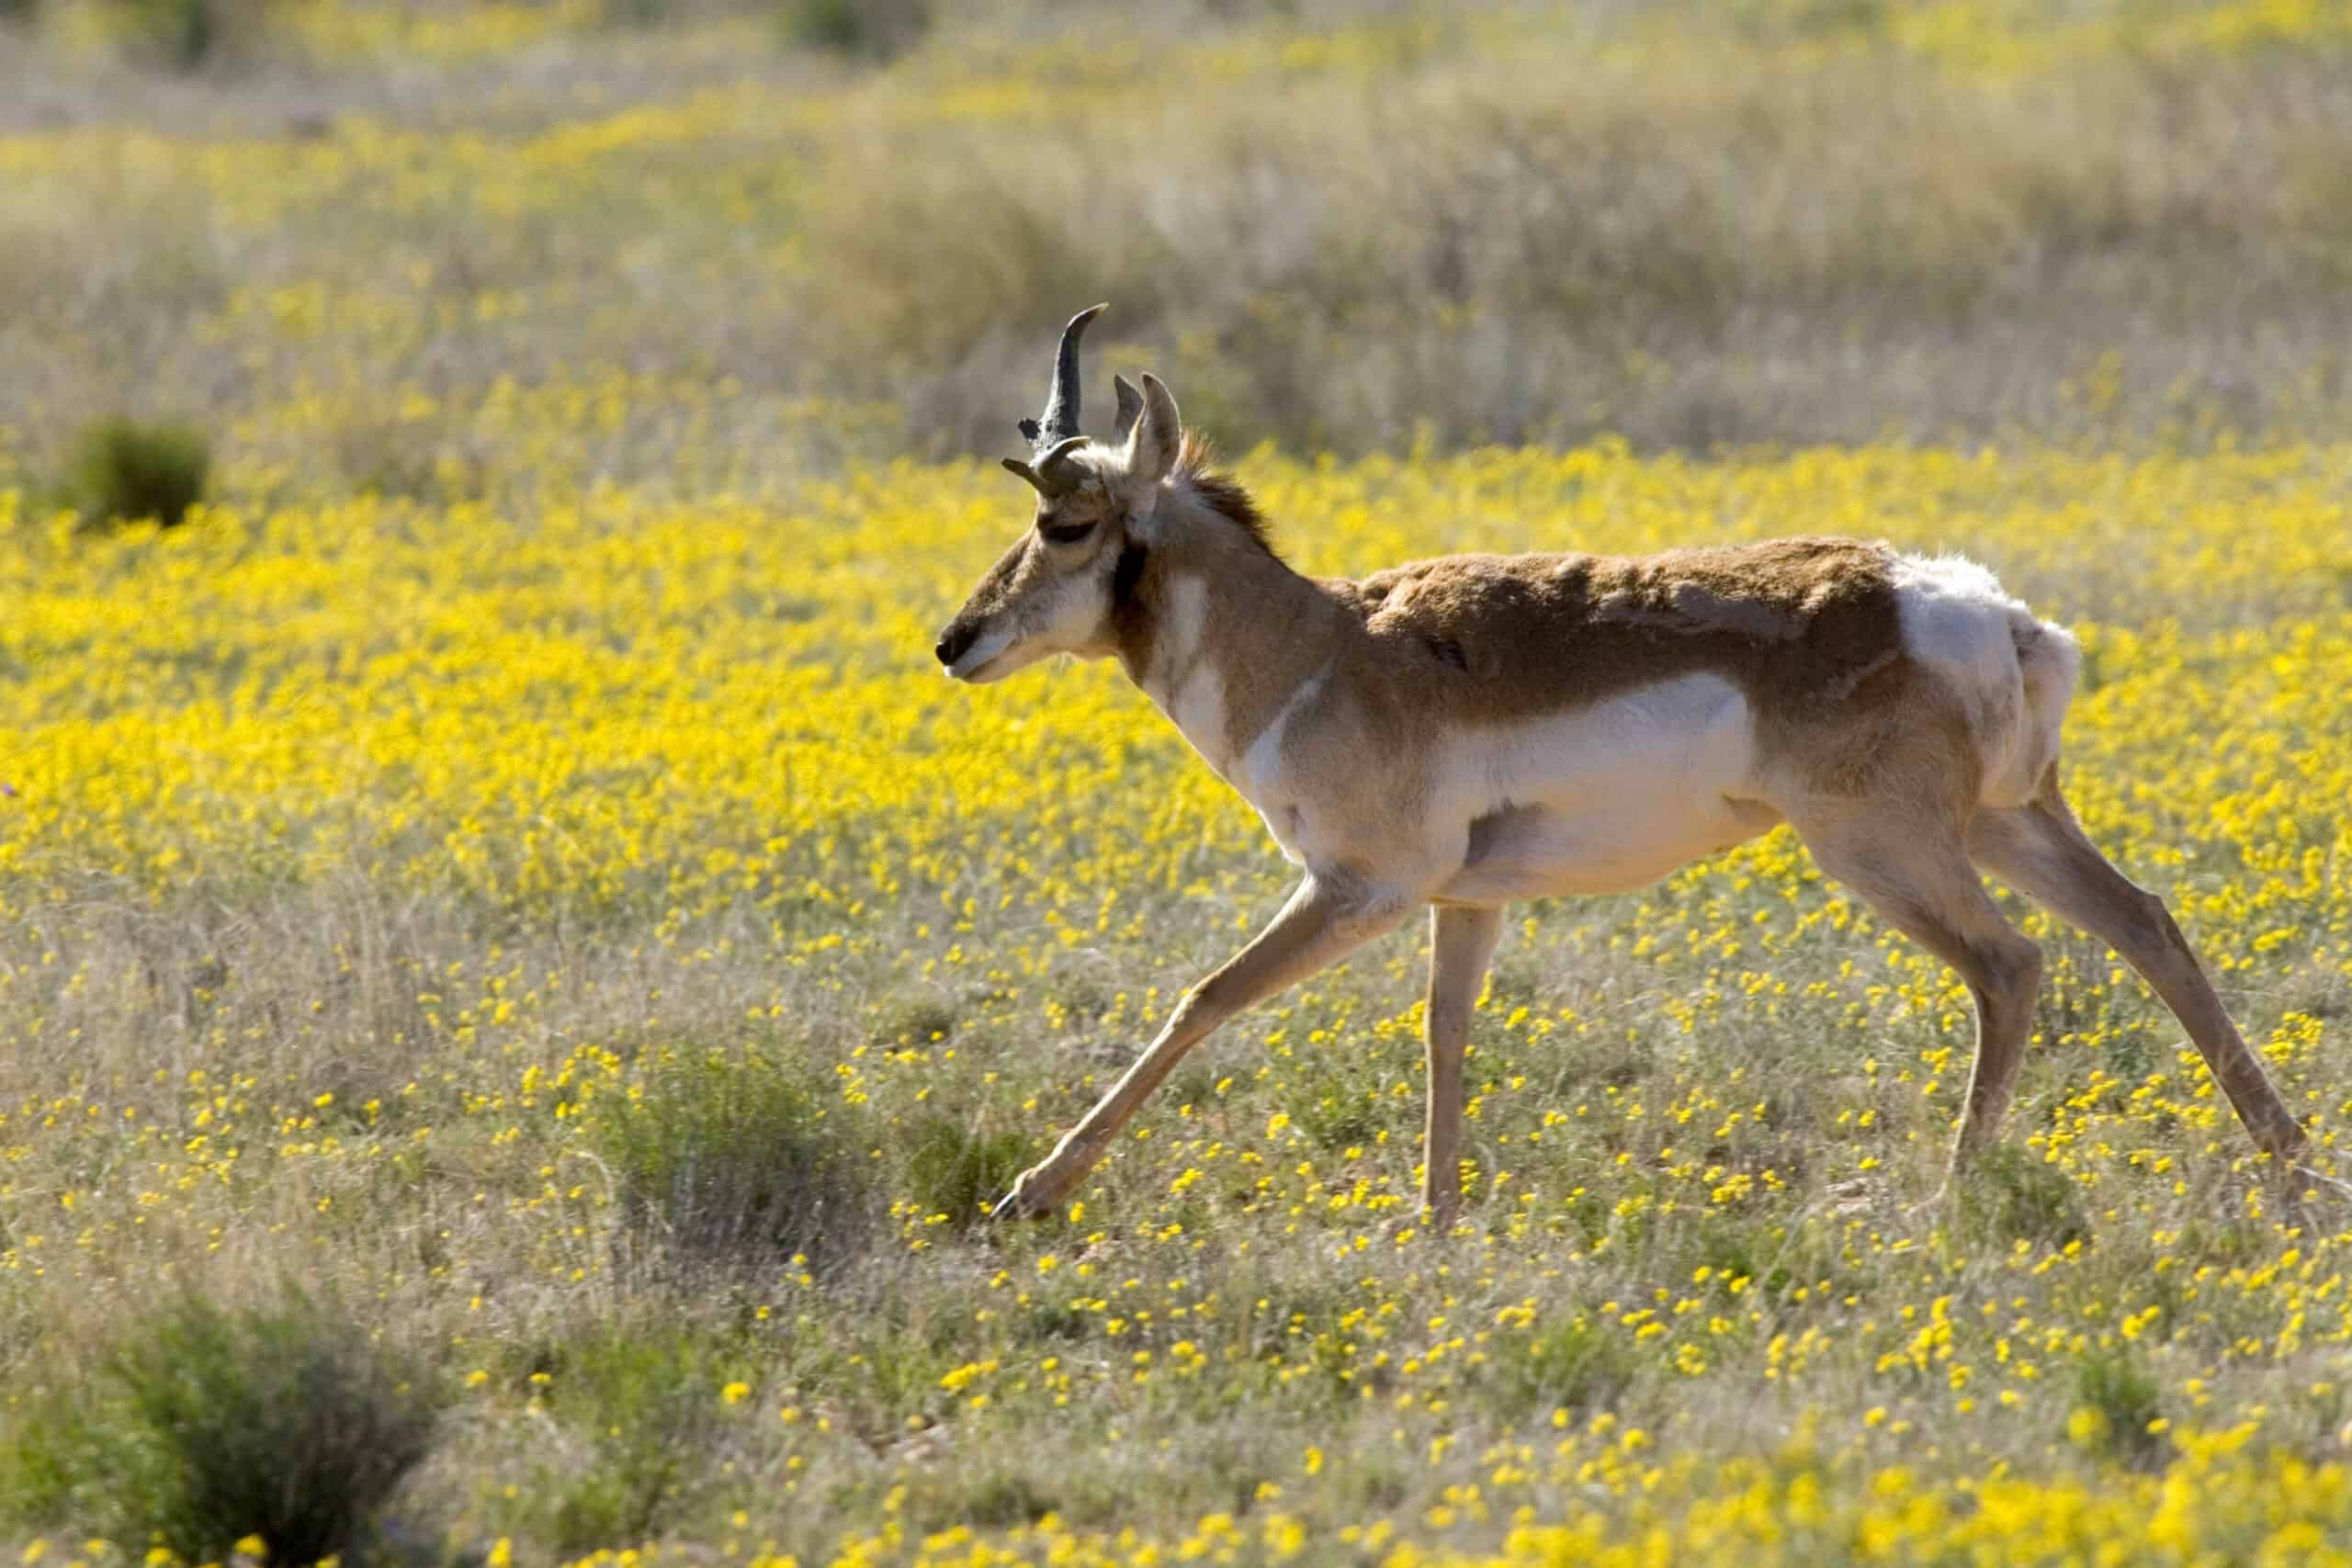
New maps expand picture of big-game migrations in the West
The maps document 33 mule deer, pronghorn and elk routes